What Odds of 1.50, 2.00 and 3.00 Really Mean
Odds of 1.50 imply a 66.7 per cent probability of winning. According to records from football-data.co.uk covering 17,937 football matches, selections with odds in this range were correct 68.0 per cent of the time. For odds of 3.00, the implied probability of winning is 33.3 per cent, compared to an observed win rate of 30.9 per cent. For odds of 10.00, the figures are 10.0 per cent and 6.9 per cent, respectively.
The implied probability is compared with the proportion of selections that were correct. Selections with higher odds yielded higher winnings when successful, but were less likely to be successful.

How the Prices Compared with Results
The table categorises the selections within a 4% range of each stated odds figure. At odds of around 2.00, the selections were successful in 48.2 per cent of cases, against an implied probability of success of 50.0 per cent. At odds of around 1.50, the observed success rate was 1.3 percentage points higher than the implied probability. Records from football-data.co.uk also underpin returns on a flat stake, reflecting historical results when the same amount is staked on each selection within a group.
What the odds implied and what actually happened
| Odds (within 4%) | Selections | Implied chance | How often it won | Difference | Return on a flat stake |
|---|---|---|---|---|---|
| 1.25 | 984 | 80.0% | 77.8% | -2.2 points | -2.7% |
| 1.50 | 1,545 | 66.7% | 68.0% | +1.3 points | +1.9% |
| 1.75 | 2,018 | 57.1% | 57.0% | -0.1 points | -0.2% |
| 2.00 | 2,064 | 50.0% | 48.2% | -1.8 points | -3.7% |
| 2.50 | 2,332 | 40.0% | 37.9% | -2.1 points | -5.3% |
| 3.00 | 3,172 | 33.3% | 30.9% | -2.4 points | -7.2% |
| 4.00 | 3,323 | 25.0% | 24.3% | -0.7 points | -2.9% |
| 5.00 | 1,792 | 20.0% | 18.3% | -1.7 points | -8.5% |
| 7.00 | 774 | 14.3% | 10.7% | -3.6 points | -24.9% |
| 10.00 | 348 | 10.0% | 6.9% | -3.1 points | -31.0% |
Source: football-data.co.uk records.
The group with odds of around 1.75 came closest to its implied probability of winning, with a deviation of just 0.1 points. Meanwhile, the group around 10.00 had the lowest win rate and return on a fixed stake.
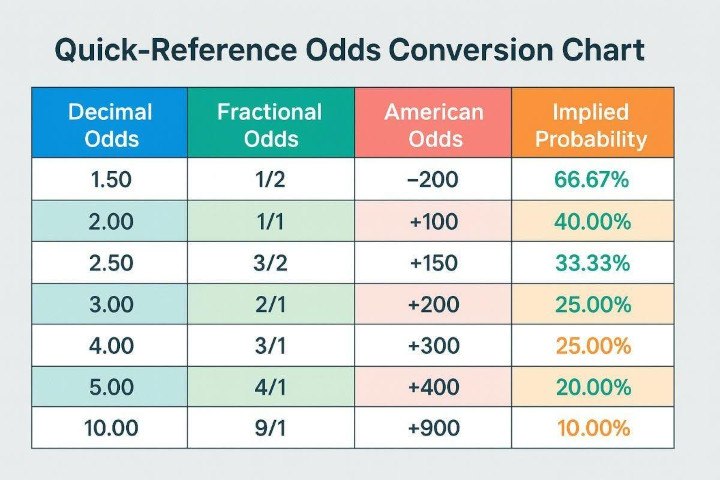
Turning Decimal Odds into a Chance
The conversion is carried out using a single calculation: implied probability = (1 ÷ decimal odds) × 100. For example, with odds of 2.00, dividing 1 by 2.00 and multiplying by 100 gives a value of 50 per cent. The same formula is used to produce the 'Implied chance' column in the analysis of football-data.co.uk records.
The three headline prices
| Decimal odds | Implied chance | Observed win rate within 4% of the listed odds |
|---|---|---|
| 1.50 | 66.7% | 68.0% |
| 2.00 | 50.0% | 48.2% |
| 3.00 | 33.3% | 30.9% |
Source: football-data.co.uk records.
Decimal odds determine the total return on a winning bet, including the stake. To calculate the return, multiply the stake by the decimal odds; to calculate the profit, subtract the stake from this figure. Therefore, higher odds offer a higher return for the same stake, but are associated with a lower probability of success. The outcome with the lowest odds in a market is the favourite.
Where the Bookmaker Margin Sits
The percentages in the odds for a market usually add up to more than 100%. This excess is known as the 'overround' and reflects the bookmaker's advantage. In a perfectly fair market, the probabilities of all outcomes would add up to exactly 100%.
The implied percentages in the analysis of football-data.co.uk records retain the margin included in the recorded odds. Odds of 2.00 correspond directly to an implied probability of 50 per cent, with the margin already factored in. In order to calculate the overround, all outcomes for the same market, bookmaker and time of recording must be available.
To adjust for the margin, each implied probability is divided by the total implied market probability. Although this method assumes that the margin is distributed proportionally across the various outcomes, the sum of the adjusted values still equals 100 per cent. These remain estimates. The overround also differs from the bookmaker’s actual profit, which depends on the stakes, how they are distributed, and the outcomes.
Why the Longshot Figures Deserve Attention
A study by Cain, Law and Peel, published in the Scottish Journal of Political Economy in 2000, identified a 'favourite–longshot bias' in fixed-odds football betting in the United Kingdom with regard to results and exact scores. This bias involves overestimating the probability of rare underdog outcomes and underestimating those of favourites.
The analysis, based on data from football-data.co.uk, showed that bets with odds of 10.00 were successful in 6.9 per cent of cases, compared to an implied probability of 10.0 per cent. Assuming a constant stake, the return was -31.0 per cent. For odds of around 3.00, the return was -7.2 per cent; for odds of around 1.50, it was +1.9 per cent.
The magnitude of the differences varied depending on the price group. For odds of around 1.25, the selections won less frequently than their implied probability suggested. In contrast, the group with odds of around 1.50 exceeded this probability. Future returns depend on the available odds and subsequent bet outcomes.
Using the Percentage Before Making a Selection
Converting a price to a percentage gives a reader a common scale for comparing market expectations with a personal assessment. Before deciding to place a bet, the useful comparison is between the offered price and an independently considered chance of success.
- Convert the decimal odds shown into implied percentages.
- When evaluating the overround, check all the available outcomes in the market.
- Compare the implied probability with an estimate based on competitors and the market.
- When reviewing results, keep the recorded price separate from any later price changes.
Before the results are announced, record the forecasts, together with the source of the odds and, where applicable, the method used to adjust for the margin. When analysing these forecasts, treat the opening and closing odds separately.
Where the Figures Come From
These figures are taken from an analysis by Jabula Bets. The analysis examined the odds for home wins, draws and away wins in 17,937 matches in the Premier League, Bundesliga, Serie A, La Liga and Ligue 1. The analysis covers the 2016/17 to 2025/26 seasons and is based on average pre-match odds from football-data.co.uk.
The 'Selections' column counts the outcomes in each price category. Even if the stated probability is correct, a favourite can still lose.
18+ only. Gambling risks losing money; national counselling is available on 0800 006 008.